The best ways to track your energy consumption and spending

Monitoring your energy use is simple with the right tools.
The Octopus Energy app offers one of the easiest and most accurate ways to stay on top of your consumption.


Click the ‘Usage’ tab on the app to see your energy usage charts.
Once you’re in the usage tab, you can tap on the name of the view you’d like to explore:
Or, set your own timeframe
Our energy usage graphs show the energy you’re using in kWh and £. You can toggle between the two in the top right corner of each graph.
When you choose £, you'll see a snapshot of your energy costs excluding VAT and daily standing charges. You can find your confirmed charges including VAT and standing charges on your statement.
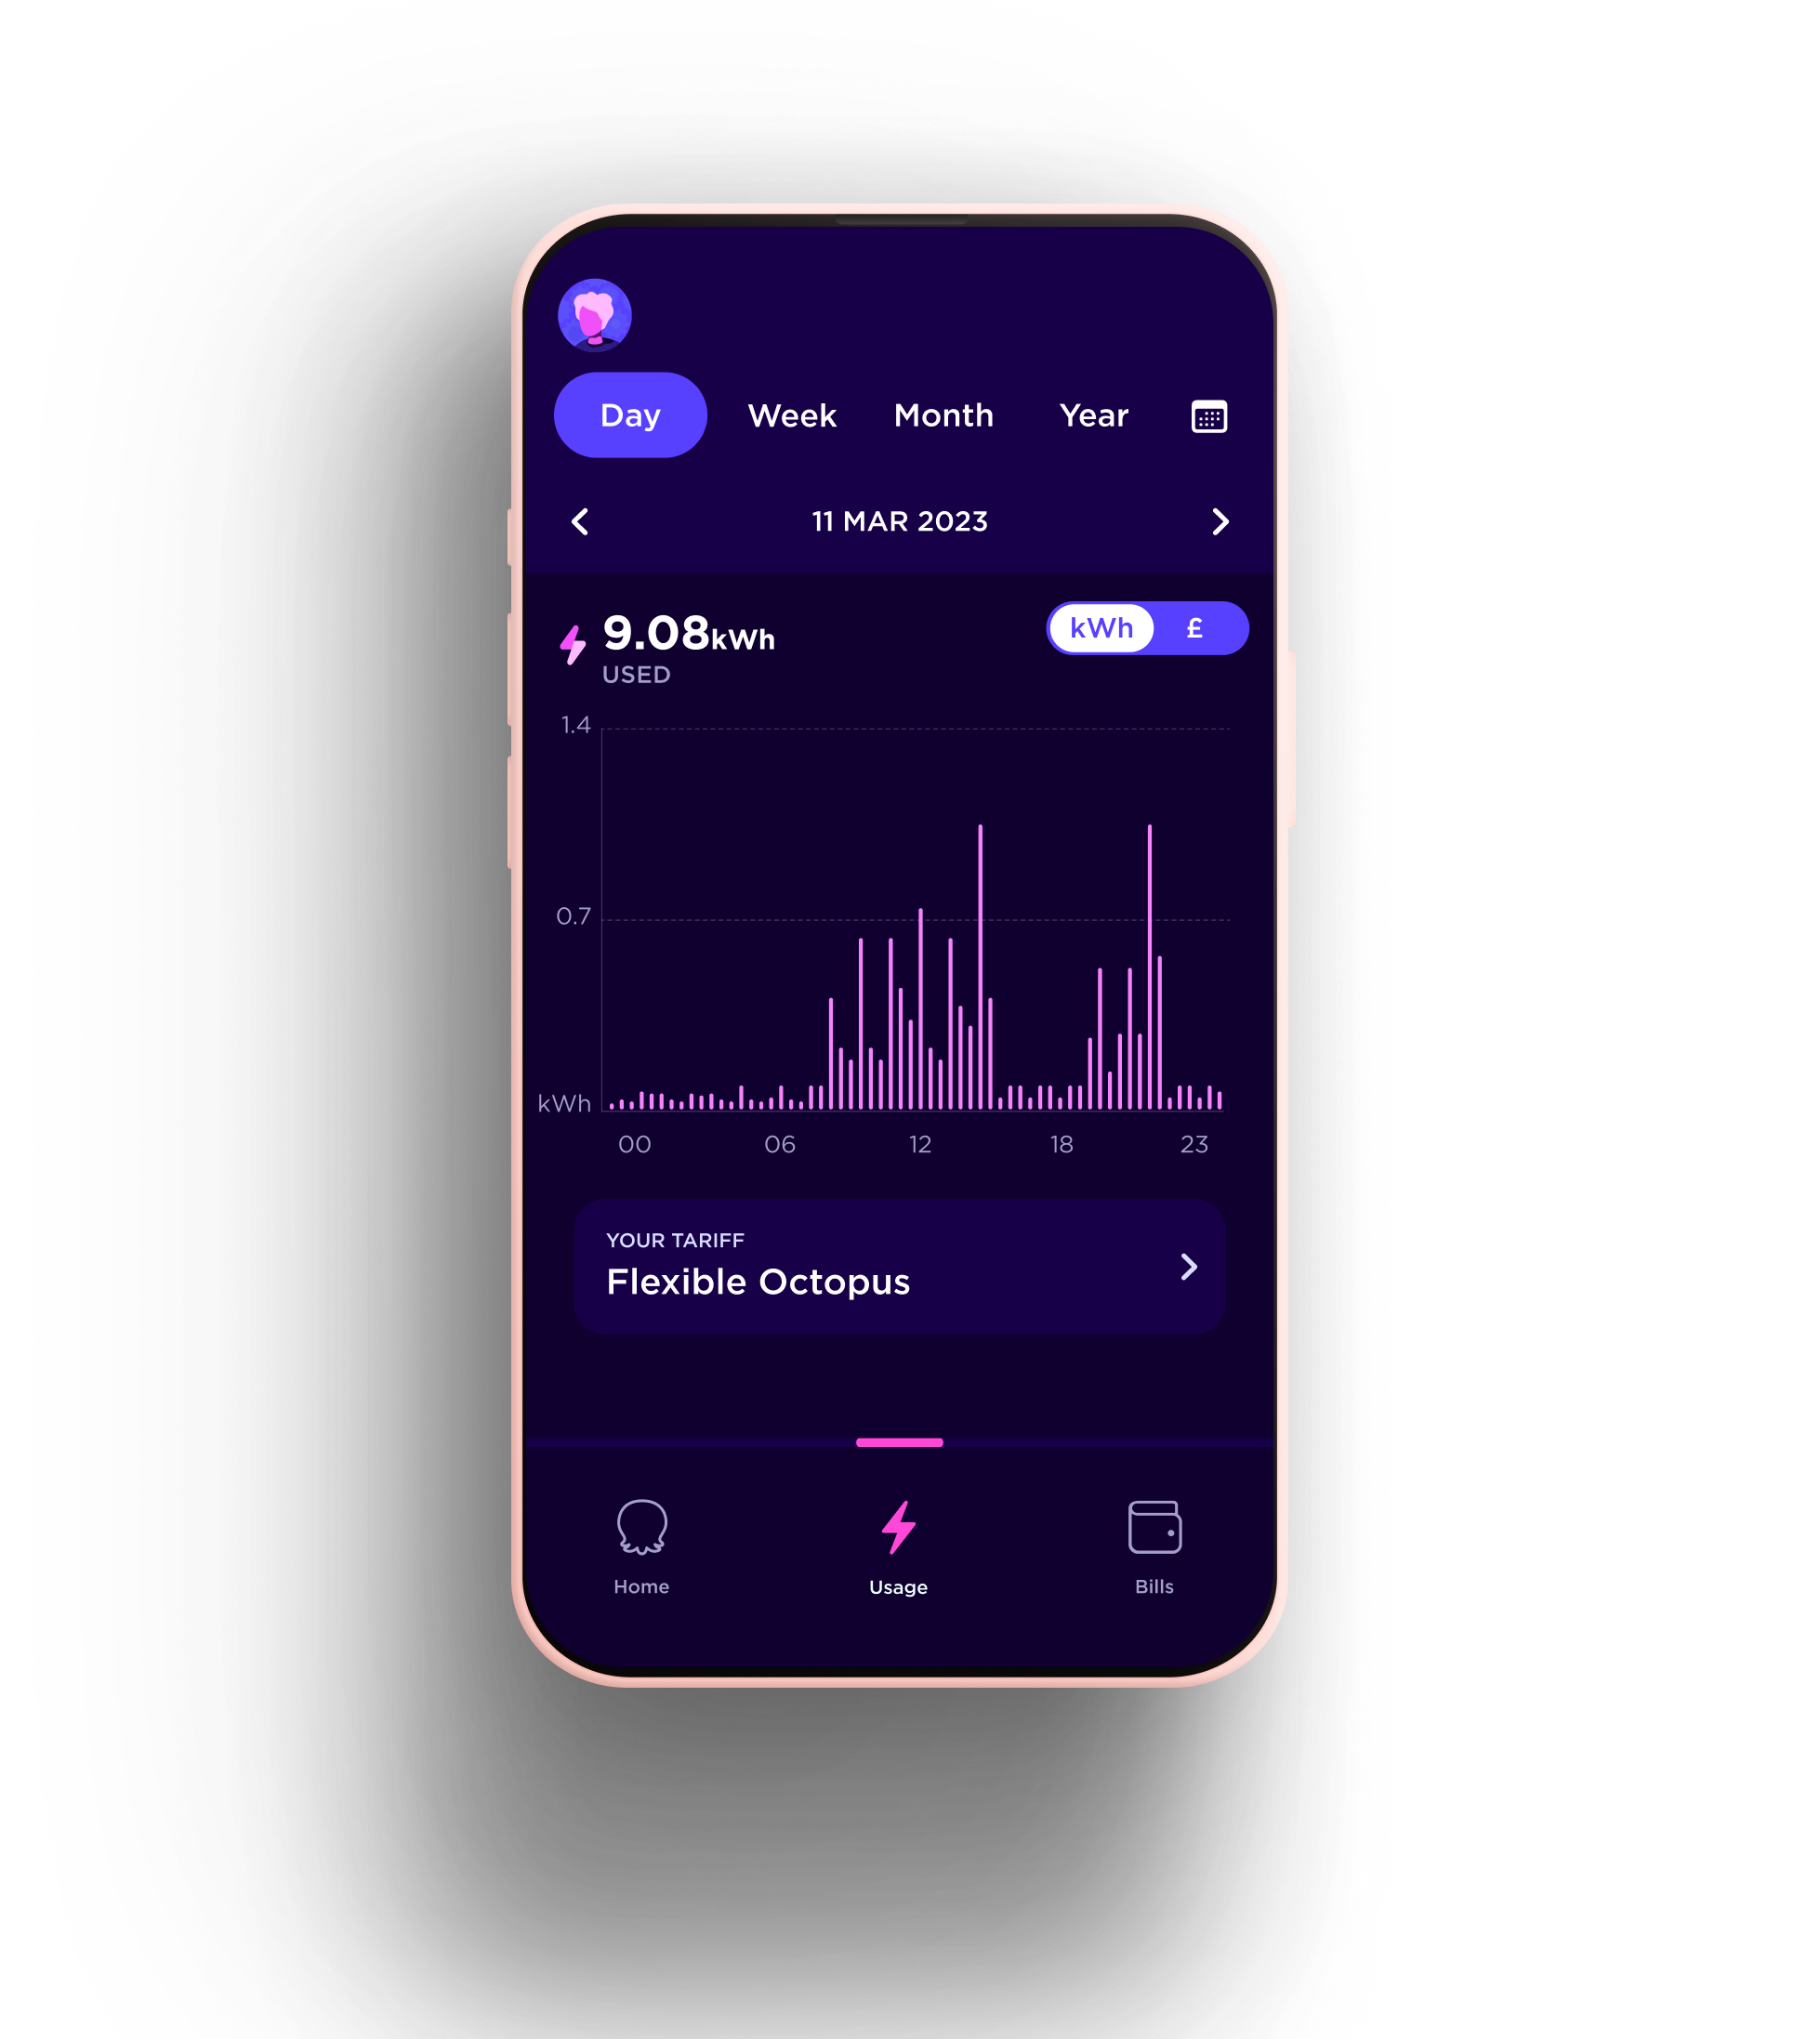
Previous day view
The charts are updated once a day. So in the morning, you can just tap ‘Day’ to take a look at your previous day’s usage, and you can flip back in time to compare your energy use day to day.
This graph gives the most detailed picture of your energy usage throughout the day. It’s only available if you’ve set your meter to take readings every 30 minutes!
The horizontal axis, which runs along the bottom of the chart, shows the time across a single day.
The vertical axis shows your electricity or gas usage in kWh, or in pounds and pence, depending on which version of the graph you’re looking at. You can tap each bar to see the specific time and usage.
Throughout the day, you can track the patterns of your gas and electricity usage - when you’re using the most, and how much that costs.
This view is a great way to see whether any energy saving efforts have done the trick and saved you power.
You can also investigate spikes in your energy use at certain times to hunt out energy-hogging devices!
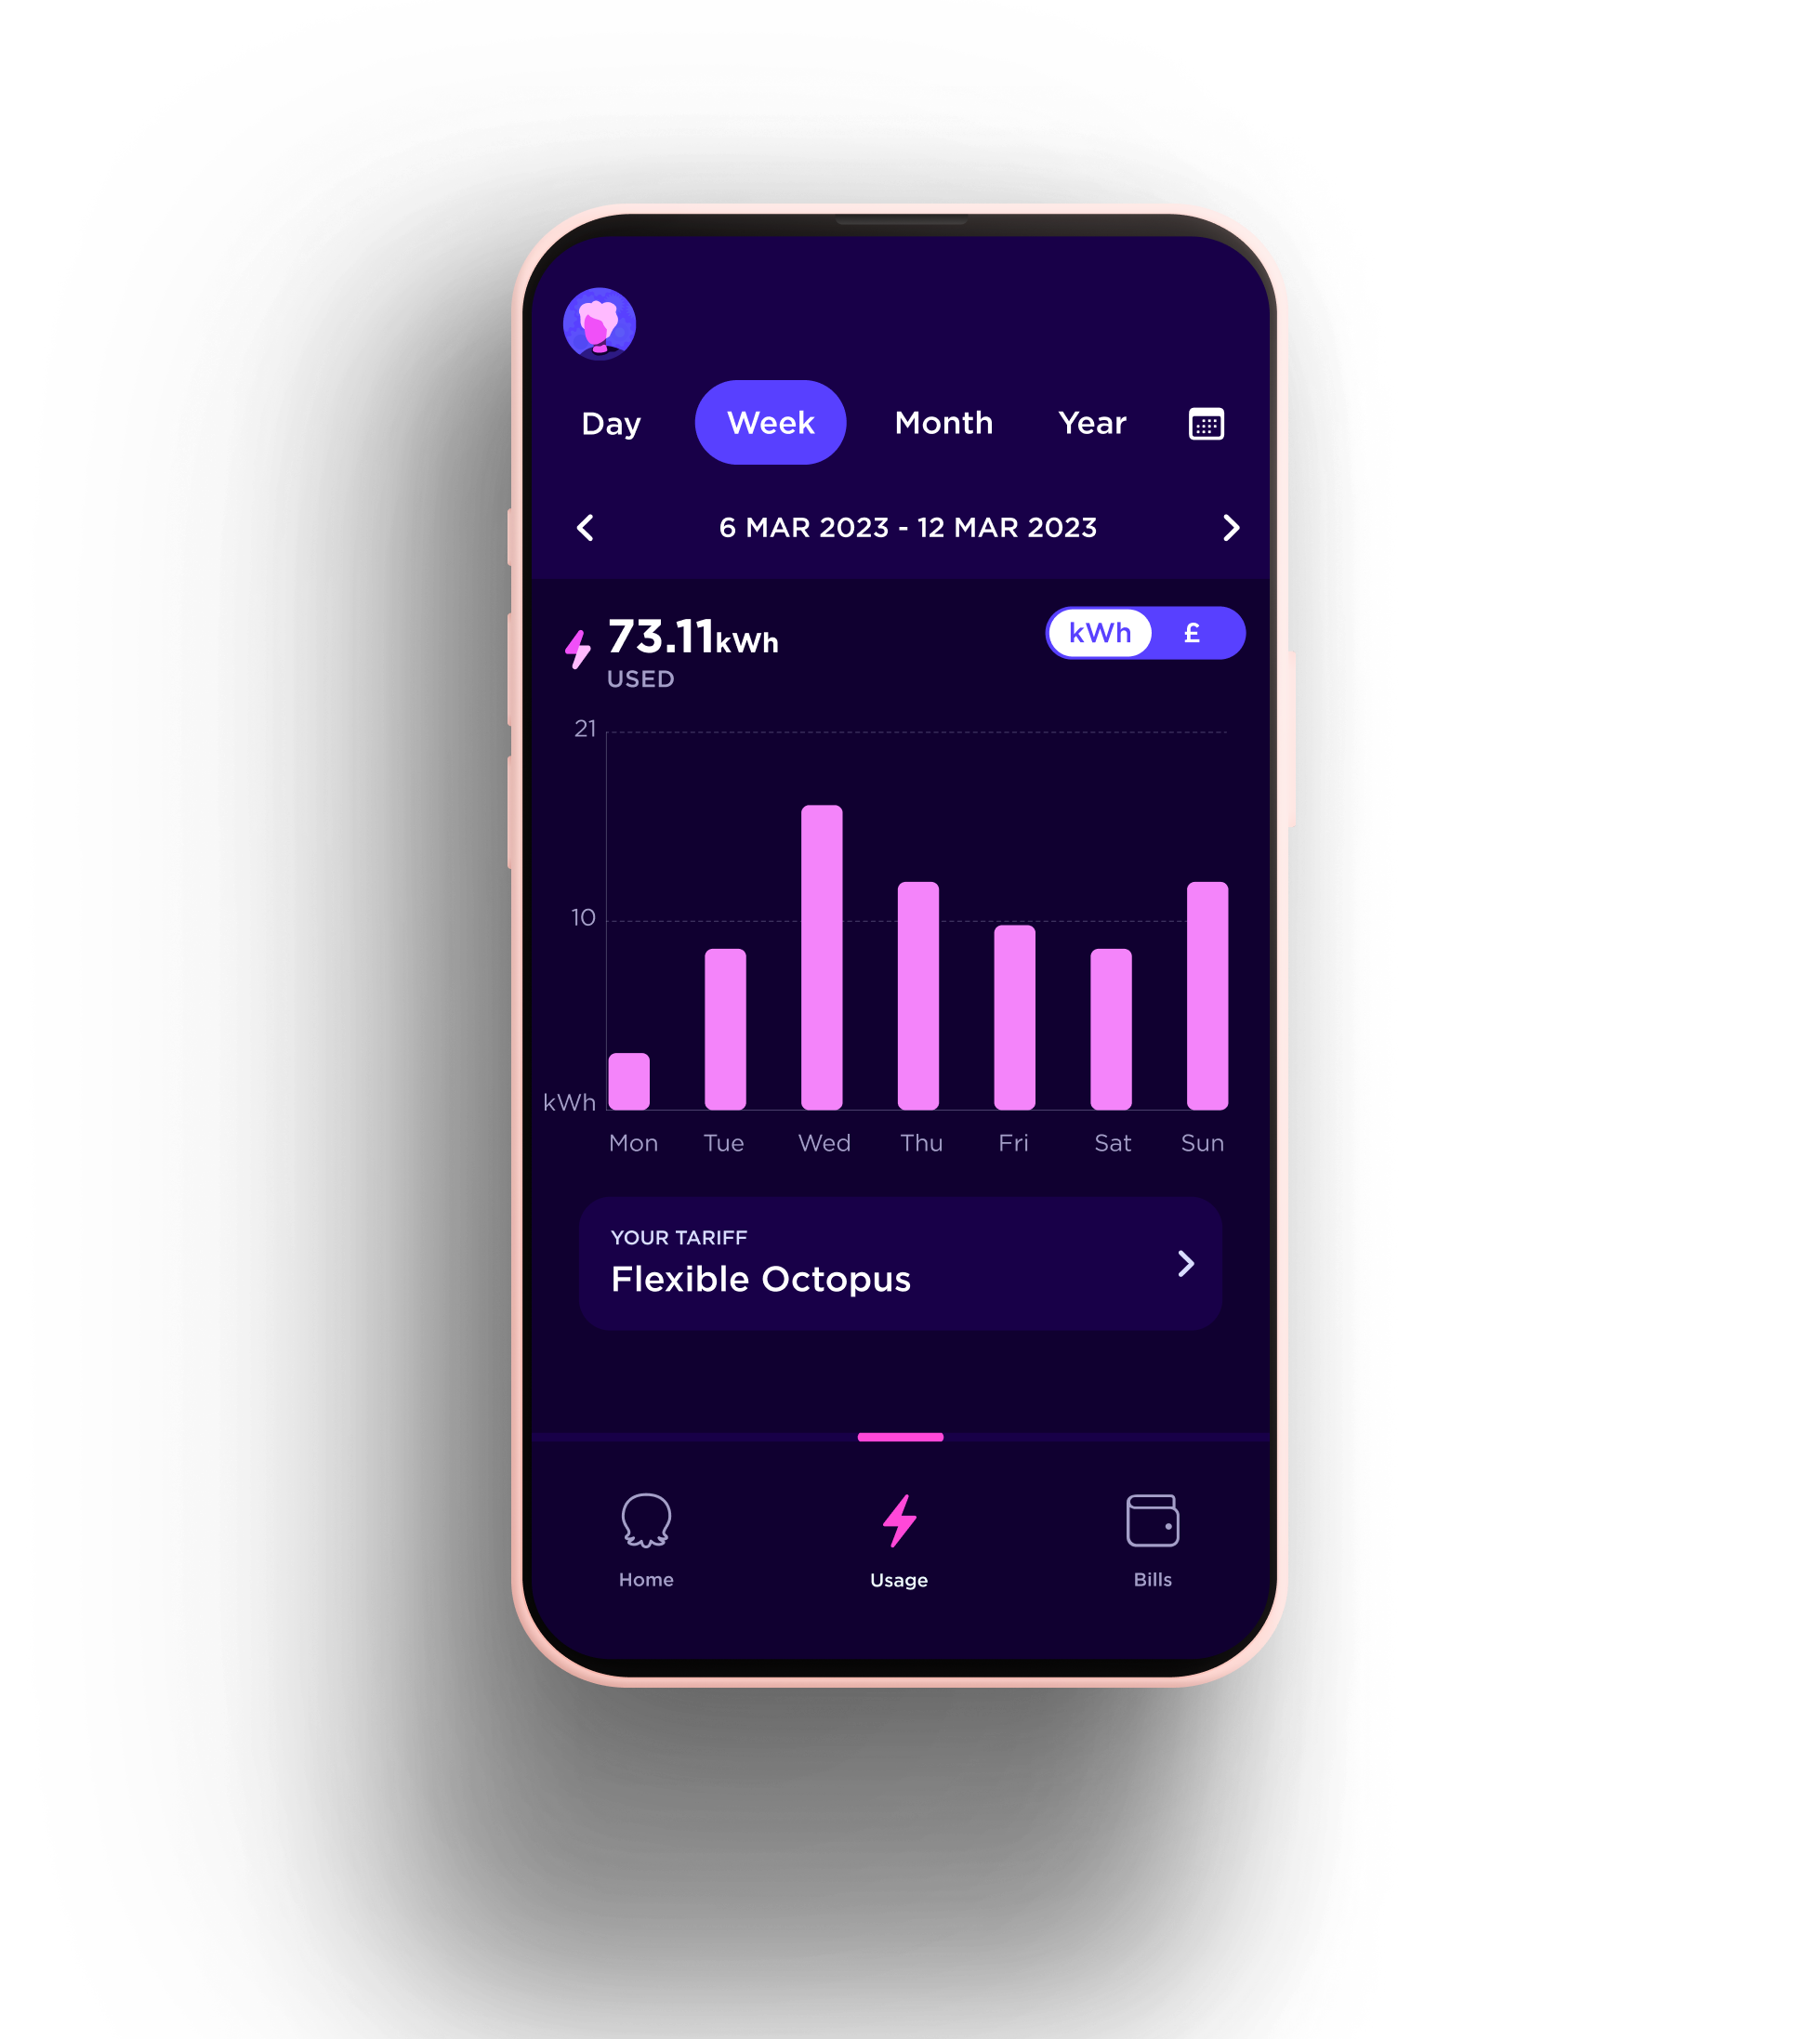
Week view
Tapping ‘Week’ will show your weekly usage, running from Monday to Sunday.
You’ll see this chart if your meter takes half-hourly or daily readings.
Your total usage for the week is shown above the chart. And each vertical bar on the chart shows your total usage per day, in kWh or pounds and pence. You can tap each bar to see the specific date and usage.
We update the weekly chart once a day, just after midnight.

Month view
Tapping ‘Month’ will show your usage for each day in the calendar month so far. You can tap each bar to see the specific date and usage.
You can also use the scroll arrows above the graph to view your usage for previous months as well. This is a good whow your energy use changes with the seasons.
Your total usage for the month is shown in the top left-hand corner of the chart.
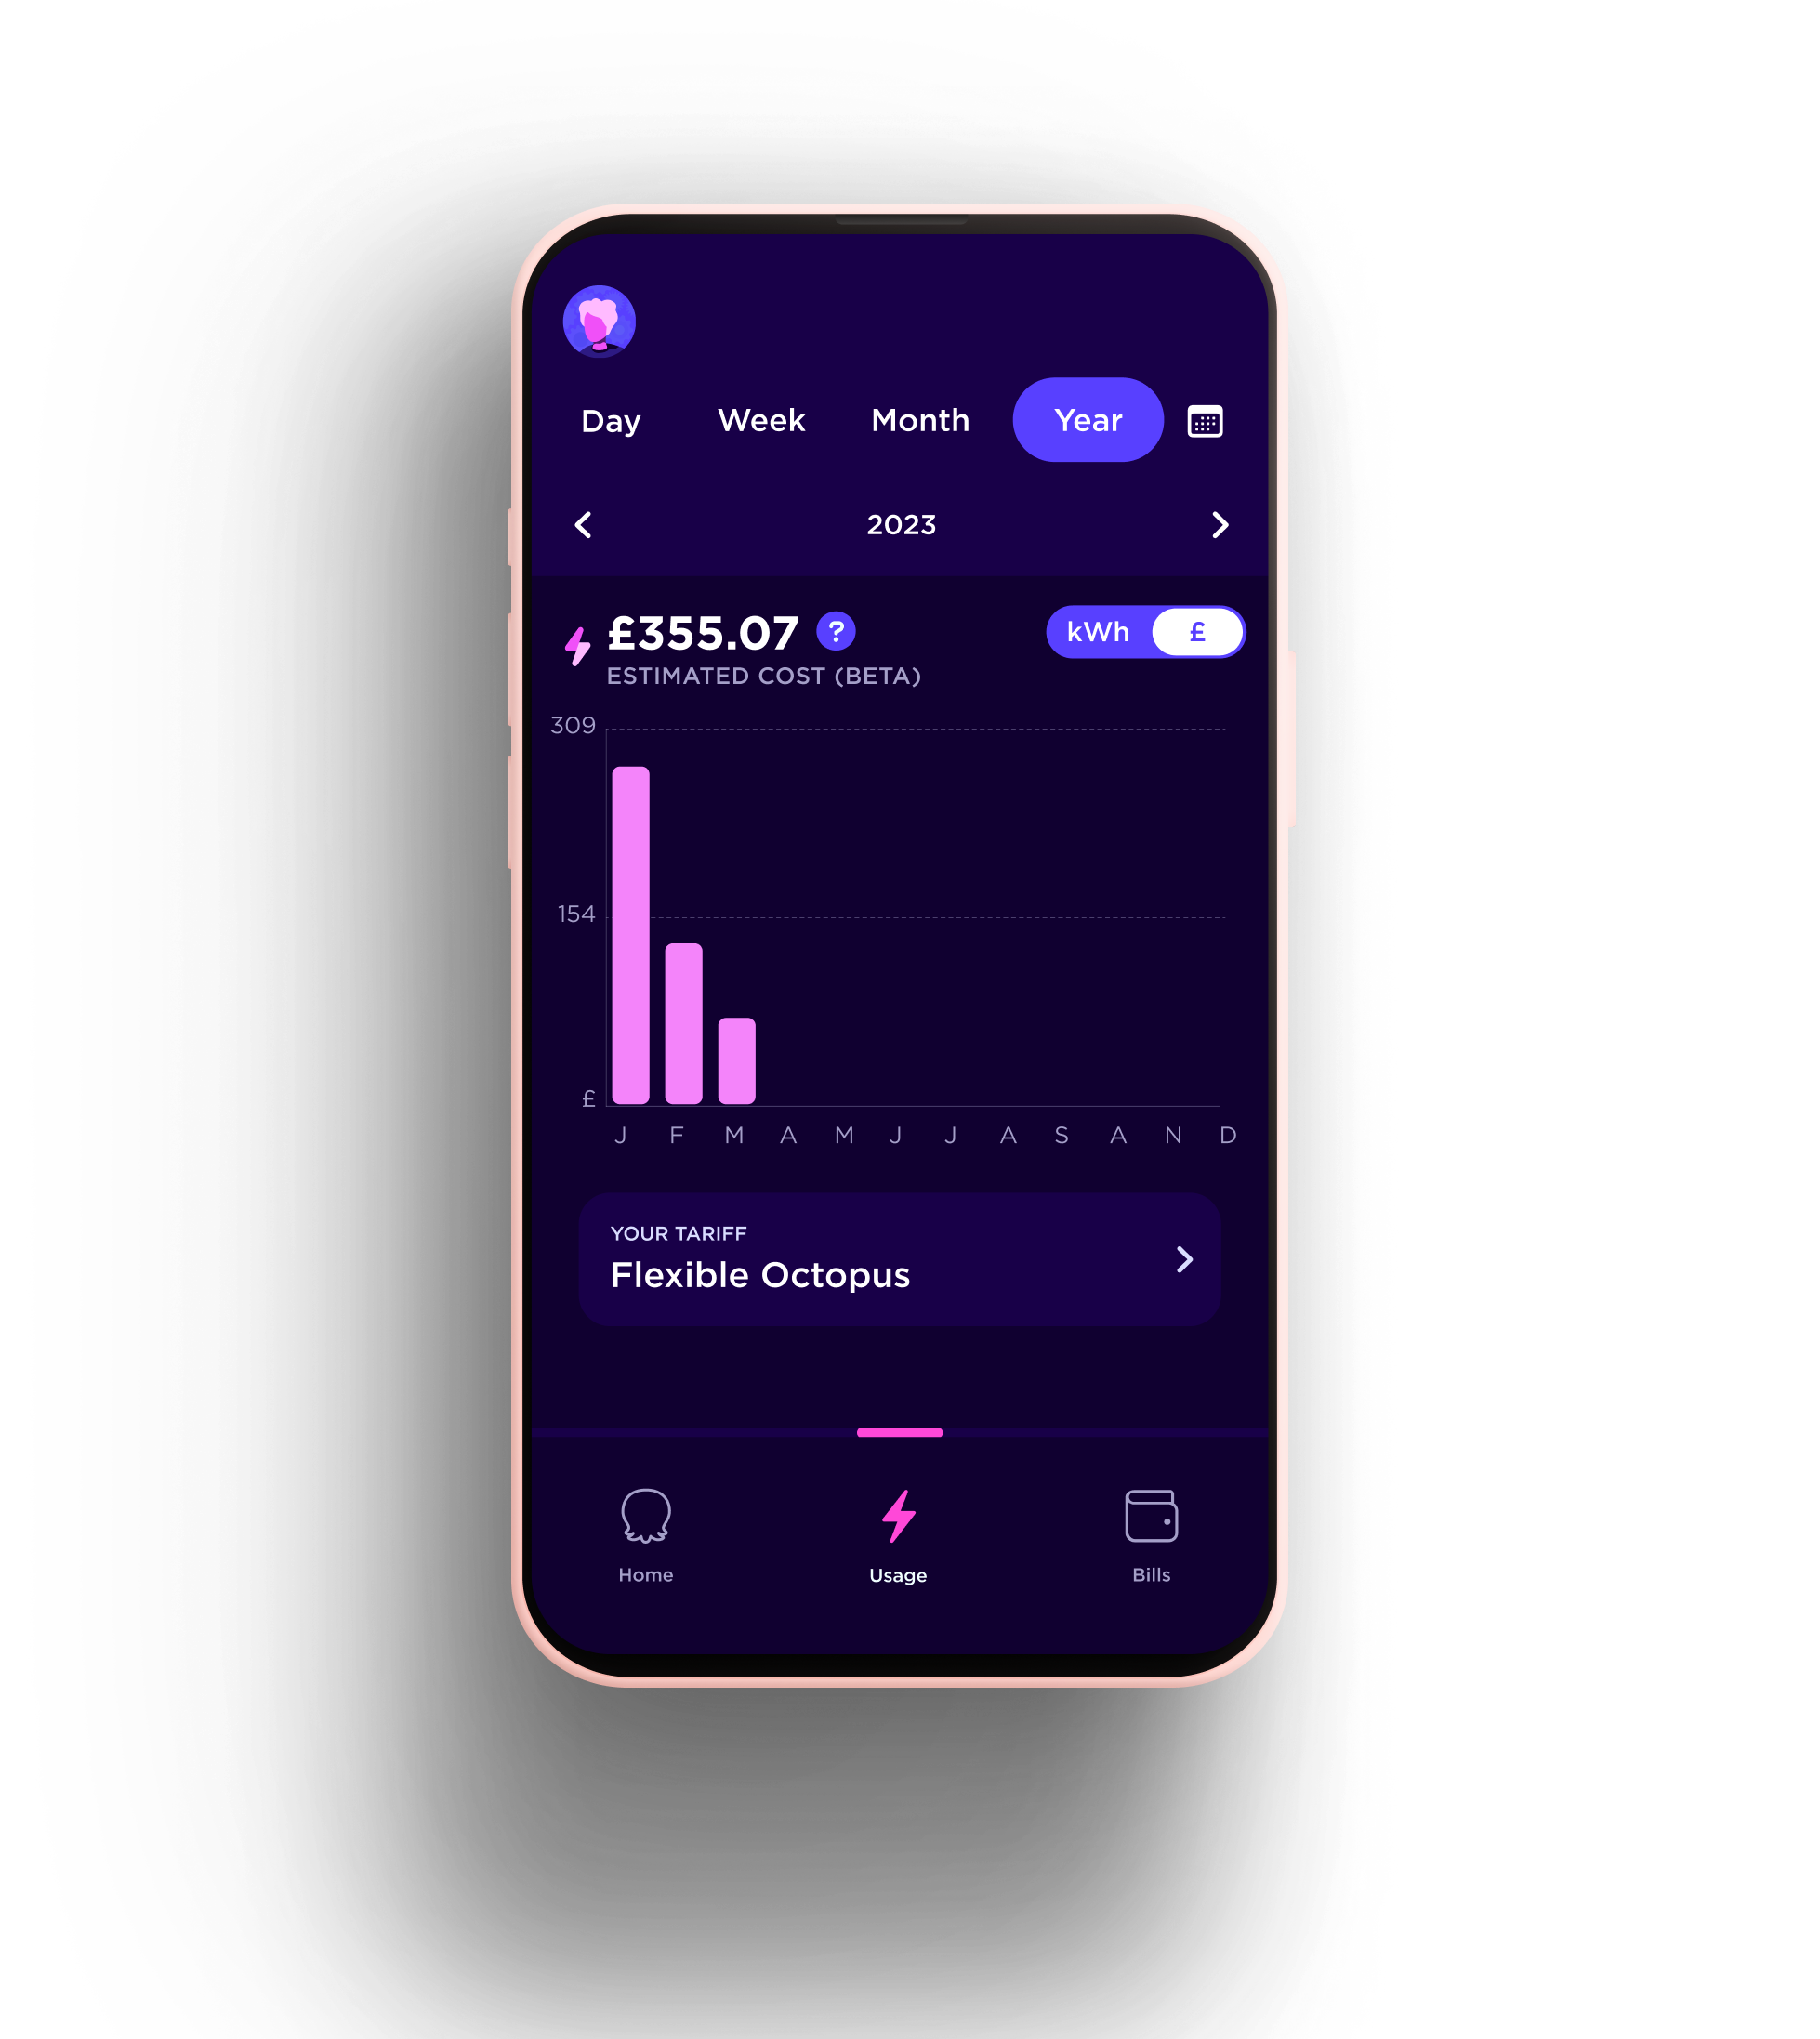
Year view
Tapping ‘Year’ will show your usage patterns as they change from month to month.
Each vertical bar on the chart shows your total usage per month.
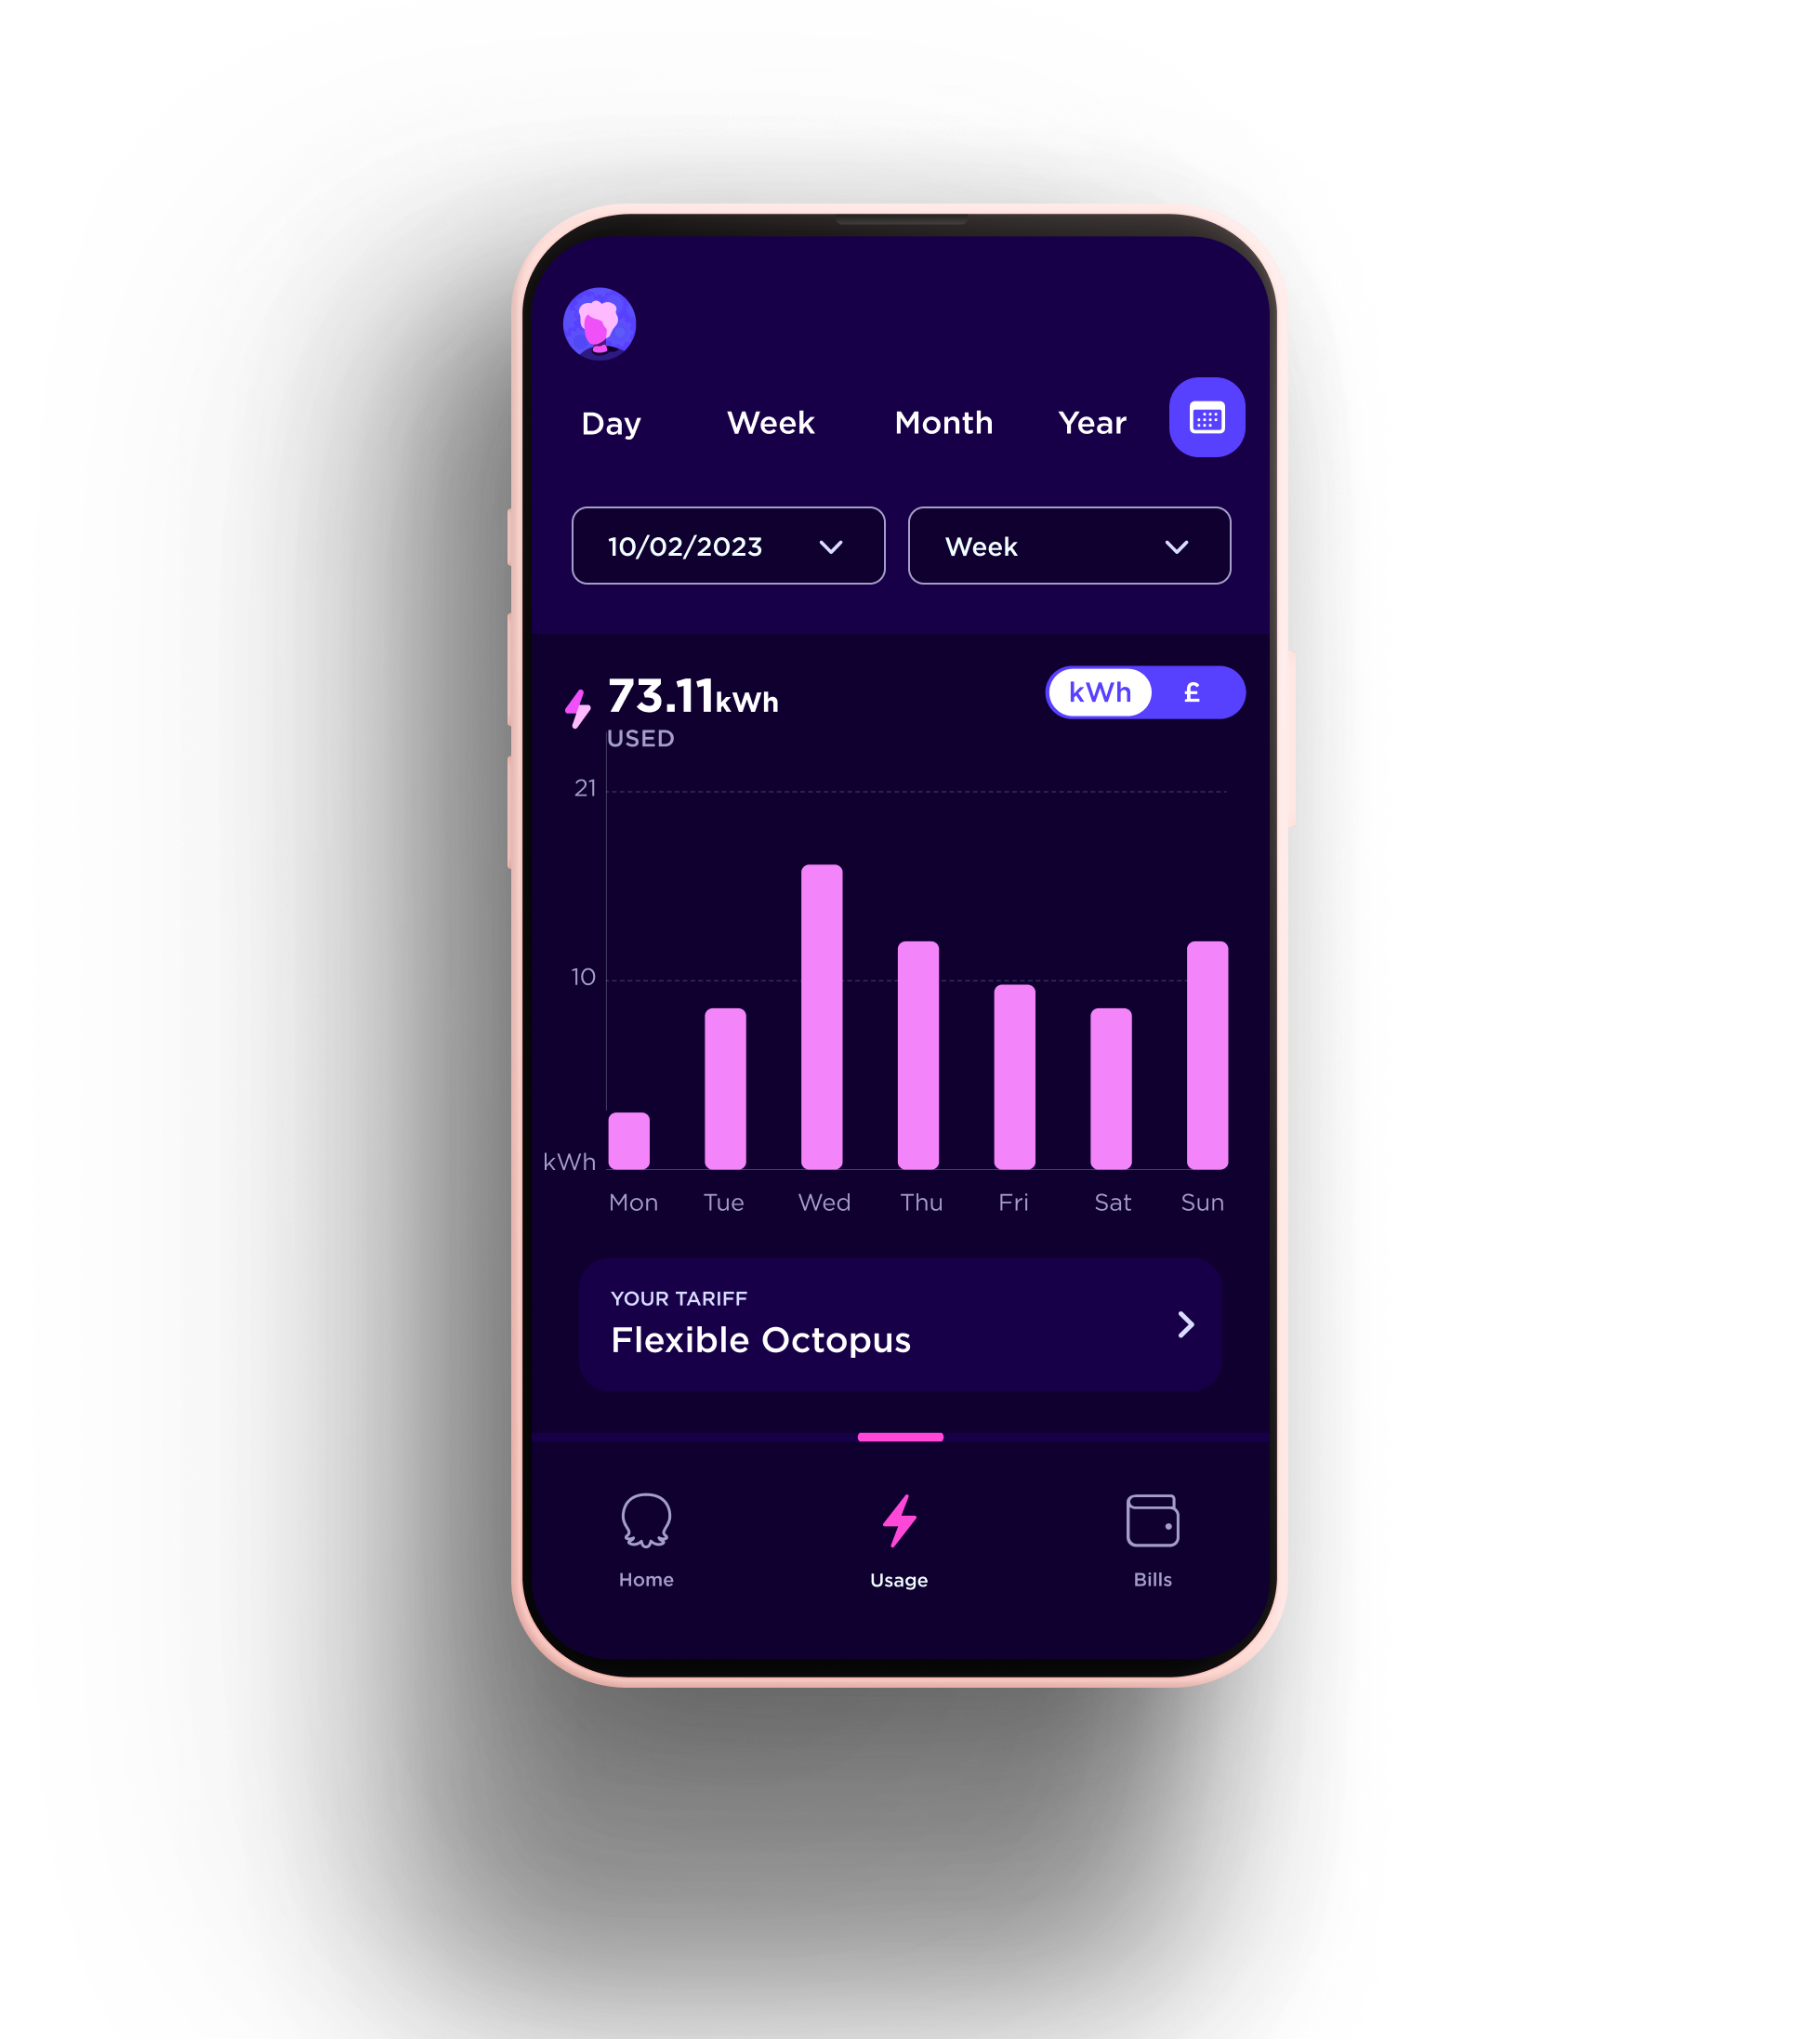
Set your own timeframe
Tap the calendar in the right hand corner to set your own timeframe.
If you’d like to see your usage from a specific date – for example, from the date you received your latest statement – you can do that by choosing the date and then selecting ‘month’ from the drop down menu on the right.
Not seeing usage?
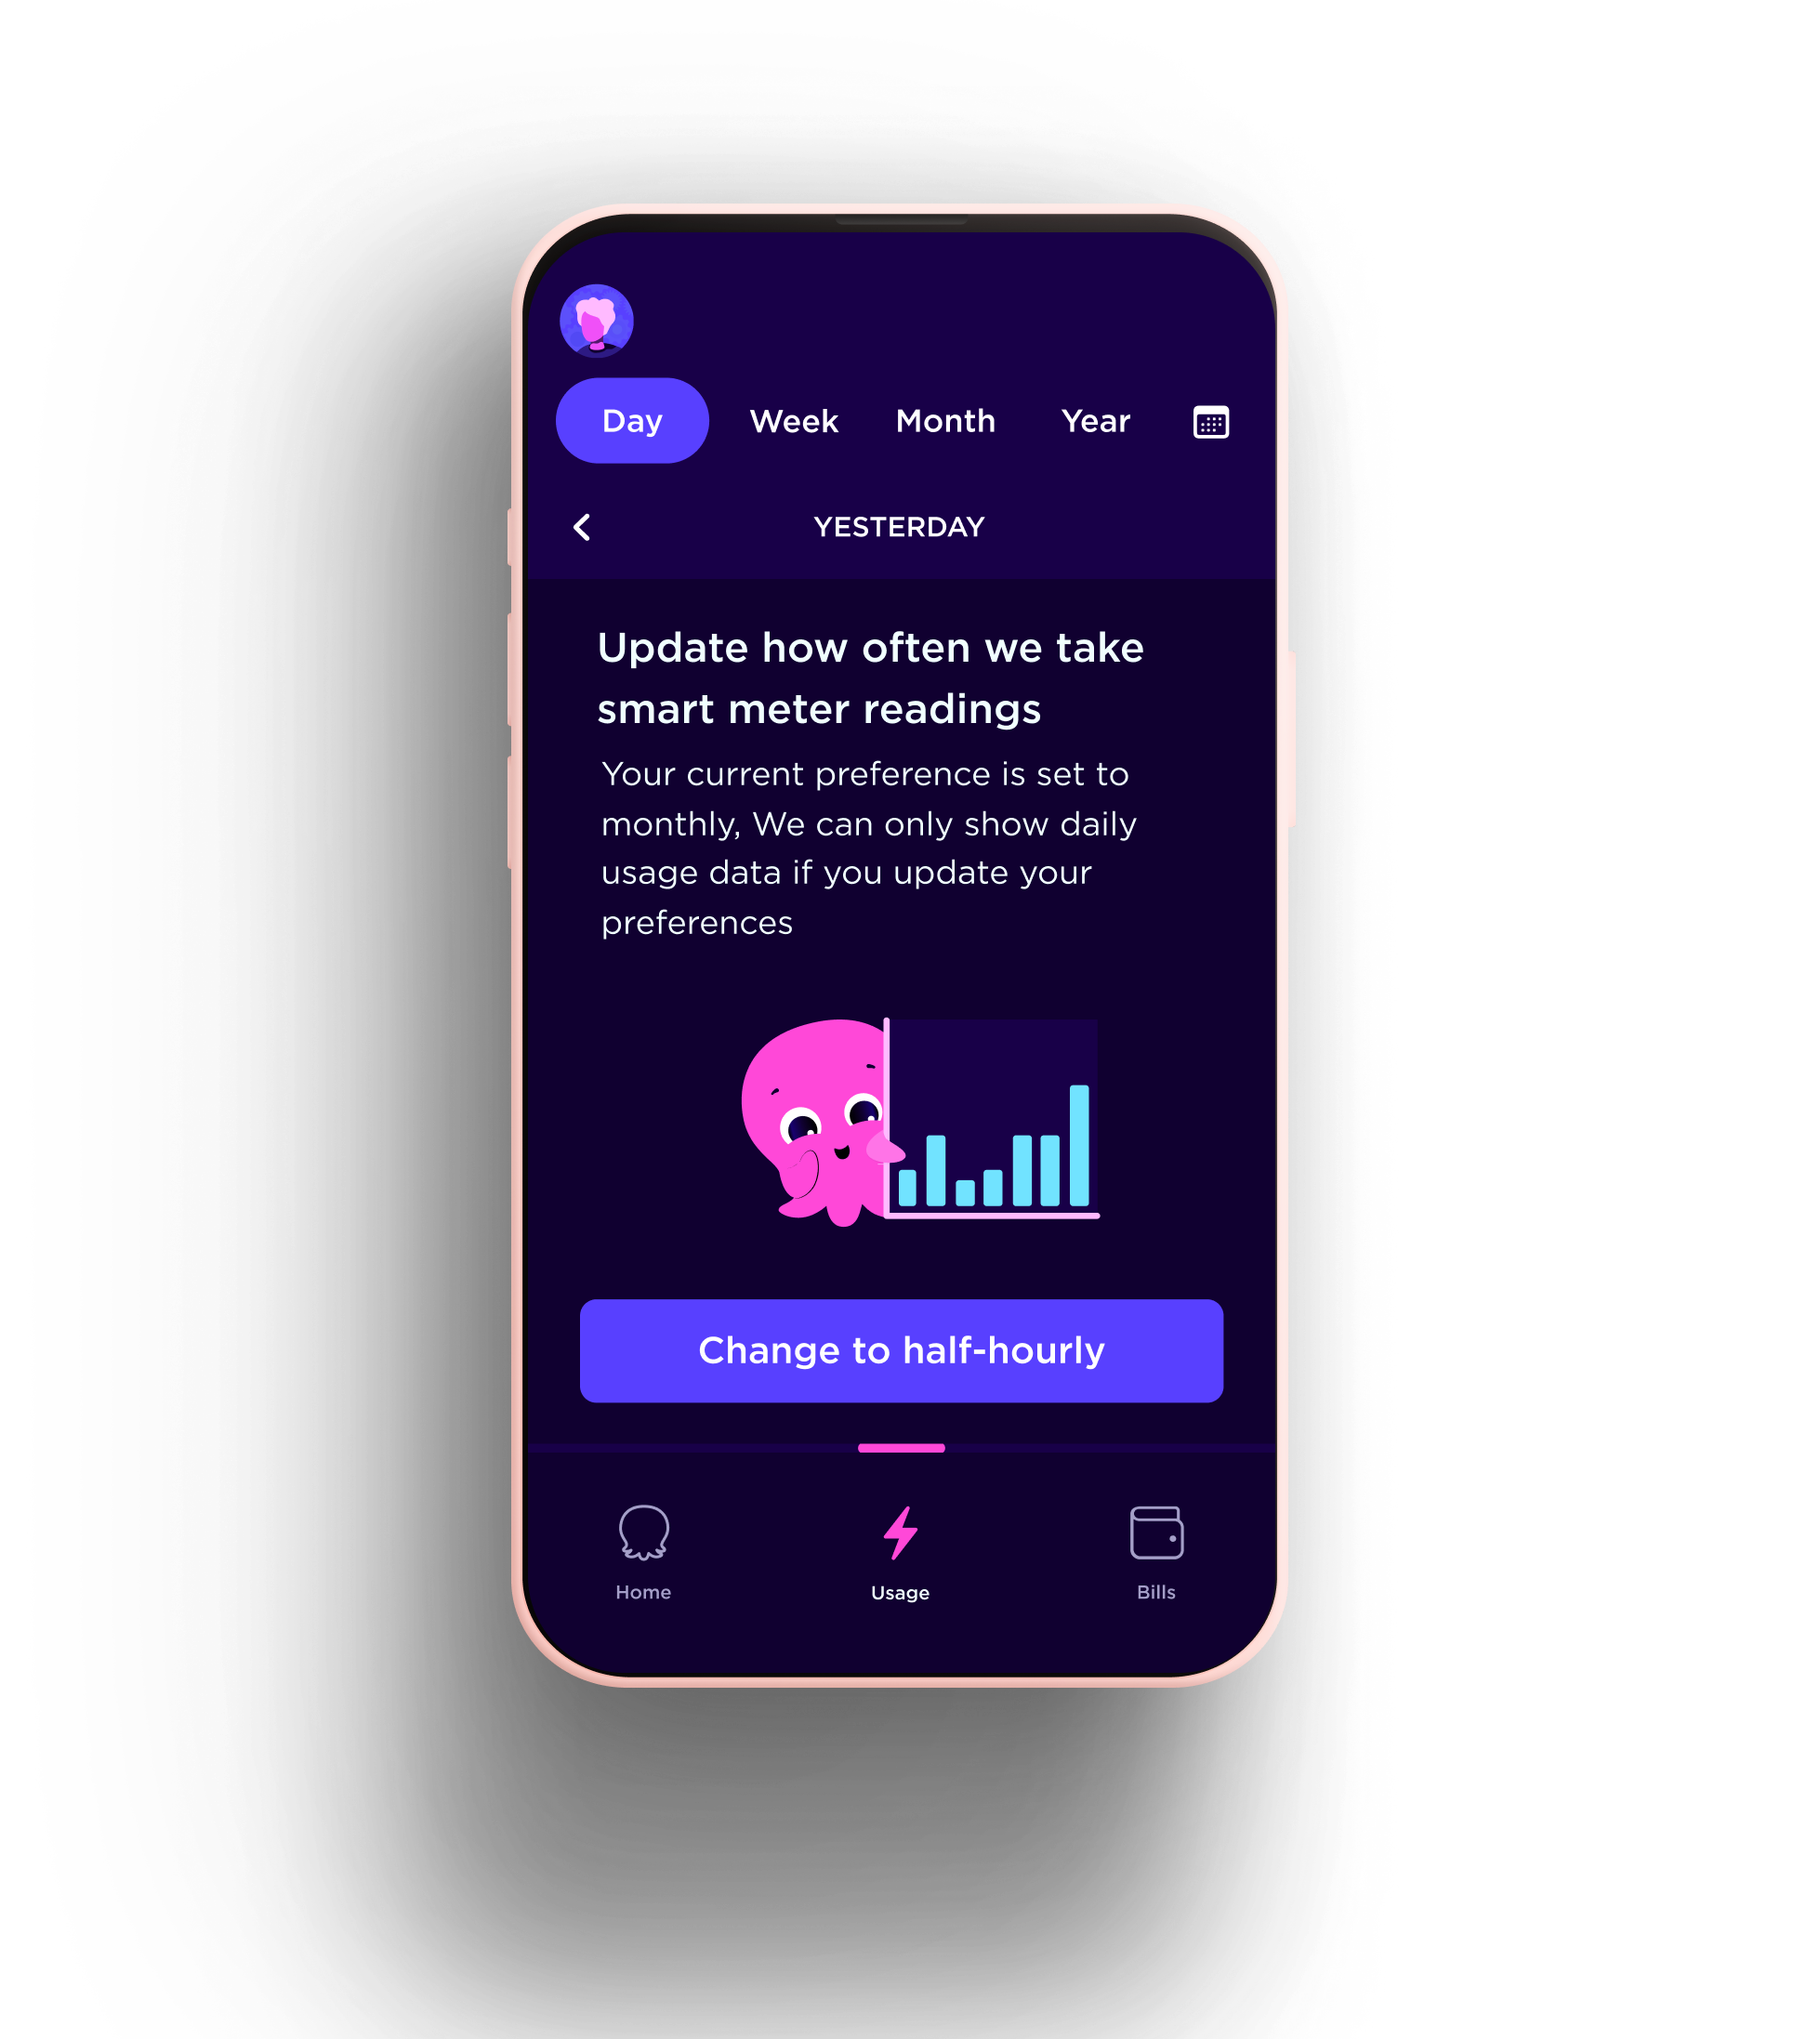
You can change how often your smart meter sends readings in your Octopus account or in your app at any time. If you haven't done this, you may not see the usage you'd like in the app.
The graphs you’ll see will depend on how often your smart meter takes readings.
If you’d like to see your daily usage, we’ll ask if you’d like to change to half-hourly readings.
If you’d like to see your weekly usage, you can change to half-hourly or daily readings.
You might see gaps in your usage when we haven’t received an automatic meter reading. This can happen when we temporarily lose connection with your meter.
Gaps in your usage normally don’t last long. But if your charts have been missing data for more than a week, get in touch and we’ll look into it.
Other ways to track your energy usage
You can track your usage in your Octopus account online as well, but you may notice your usage information is more detailed using our app.
Track your energy use on your In-Home Display (IHD)
Monitor your habits and spot power hungry appliances
Keep an eye on your energy with the Home Mini
See your energy in real time
Get the Octopus Energy App
Track your usage with energy insights
Published on

Rebecca Gillespie
Product and Marketing Executive