The growth of solar power

Ray Kurzweil, the futurist and Director of Engineering at Google, predicts that solar power will grow at an exponential rate throughout the 21st century.
In his essay “The Law of Accelerating Returns”, Ray believes the growth of solar will resemble Moore’s Law: the doubling of computer capability every two years.
During an interview in 2011, Ray explained:
“Solar panels are coming down dramatically in cost per watt. And as a result of that, the total amount of solar energy is growing, not linearly, but exponentially. It’s doubling every 2 years and has been for 20 years. And again, it’s a very smooth curve. There’s all these arguments, subsidies and political battles and companies going bankrupt, they’re raising billions of dollars, but behind all that chaos is this very smooth progression.”Ray Kurzweil, Google
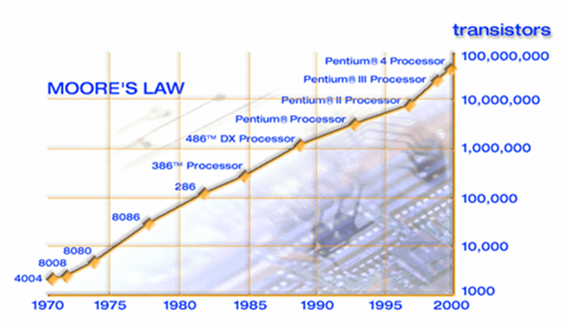
Image source: Intel
This is an exciting idea. In 2011, solar PV (meaning “photovoltaic” – the type of panel used to generate electricity, as opposed to thermal panels that generate heat) generated 60.6TWh or 0.27% of global electricity generation. Based on Ray’s simple number crunching, we could, in theory, generate enough energy to meet today’s entire world’s electricity demand with solar by 2029. In reality, we wouldn’t want to rely only on solar, and growth in the early years is likely to be quicker than later on – but it would be interesting if solar power has doubled every two years this century, wouldn’t it?
So, is solar PV still seeing exponential growth six years on from Ray’s prediction?
Global growth of solar since 2000 – in numbers
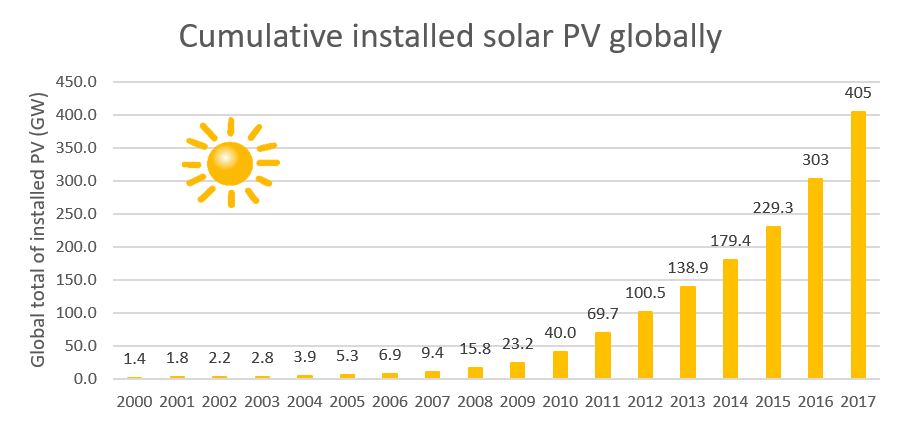
At the beginning of the 21st century, global installed solar PV capacity paled in comparison to today’s figures. Estimates put the total installed PV capacity in 2000 at around 1.4GW. To put this figure in perspective, China alone installed ten times this amount of solar PV in 2014.
Source (years 2000–2013): Global Market Outlook for Photovoltaics 2014-2018 (EPIA, 2014), Source (year 2014): Global Market Outlook for Solar Power 2015-2019 (SSE, 2014), Renewables Global Status Report 2017 (REN21, 2017)
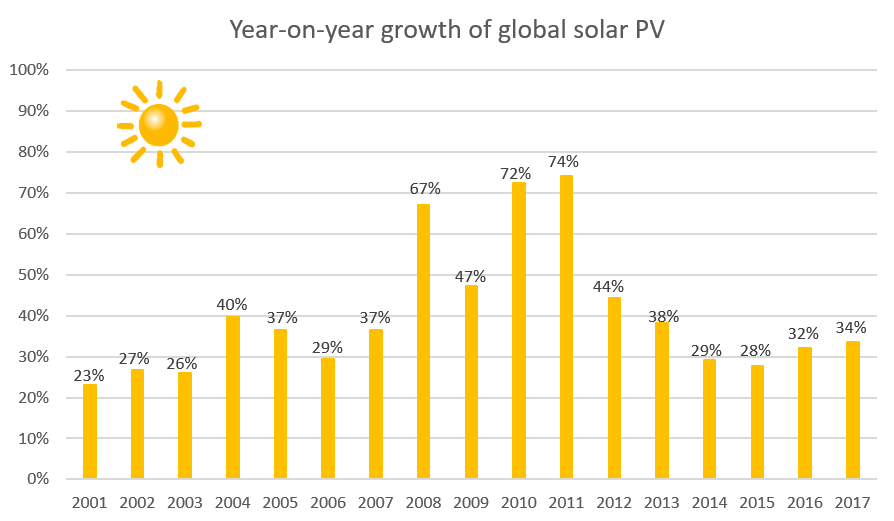
For the next seven years, from 2000 to 2007, the world saw gradual but impressive double-digit growth of between 20%-40% year-on-year (YOY).
It is fair to say that 2008 to 2012 was a boom in the global solar PV market – the rate of new installations almost doubled to between 50% and 75% YOY.
This has been followed by a period between 2013 and 2014 where growth rates have returned to around a 30%-40% range. At the end of 2017, it is estimated that around 102GW has been added to global PV capacity since 2016, bringing the global total to 405GW.
Where has the growth been coming from?
Germany was the solar PV leader up until 2014 with 40GW of solar (equal to around 20 coal-fired power stations). Then, the German energy program Energiewende was wound down, allowing China and Japan to overtake, with the USA close behind.
China had as much solar as Germany (40GW) in 2015 and then almost doubled this figure again in a single year in 2016. The latest figures for the end of 2017 show that China has continued to build solar power at an astonishing rate, adding 53GW in 2017. This puts them at a total of 131GW of solar, almost four times the UK’s average total electricity demand. So much for China not pulling their weight, Donald.
India also had a huge year in 2017. In 2016, India had a total of 9GW of solar. However, in 2017 they added another 9GW, doubling their installed capacity and bringing them up the top 10 world rankings.
Japan achieved a steep increase following the introduction of a generous feed-in-tariff in 2012. Japan’s solar market grew fast after this, but cooled off slightly between 2015 and 2017.
The USA has also managed to grow at an impressive rate since 2012. A US record of 14.7GW of solar was added in 2016, but this has dropped down to 10.6GW added 2017. Italy’s growth was impressive for a small country but has remained largely flat since financial incentives were removed in 2013.
The remainder of the top 10 is led by the UK, followed by France, Australia and Spain all with between 5.6GW to 12.7GW of installed capacity.
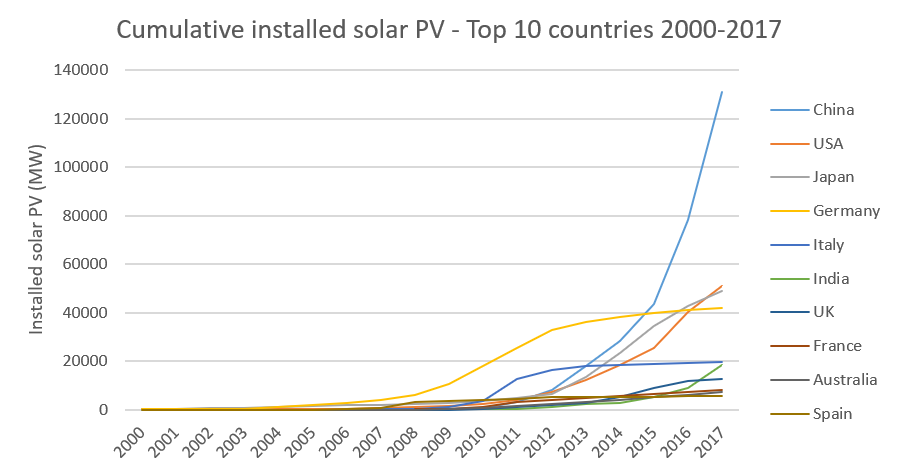
Germany and Italy were responsible for 72% of all growth in the boom years of 2008-2012. Growth is concentrated in China, Japan, the USA and increasingly India, today.
How has solar compared to Moore’s Law?
To measure the growth of solar over fifteen years, we can use the compound annual growth rate (CAGR), which is similar to the way you would calculate your average interest on a bank account over a period of time.
For the growth of anything to double every two years and follow Moore’s Law, a minimum CAGR of 41.42% is needed. The CAGR of global solar PV installations from 2000-2017 was 42.34%, meaning it has done almost exactly that!
On average solar has been doubling every two years since the beginning of the 21st century, and so far, Ray Kurzweil’s prediction has been accurate. Let’s hope Ray continues to be right over the next 15 years. Or at least not far off…
Home solar and battery storage installation with Octopus
How does Octopus Energy do green power?
Ditch gas and get a heat pump
Published on

Charlie Cook
Clean Energy Analyst